
How does the model work?
When using a data model, it is important to have a clear understanding of all the required inputs, where the data is coming from, and how the different inputs are used to produce a result. The following describes the inputs used by RIEM to estimate the number of crashes prevented by roadside inspection and traffic enforcement.
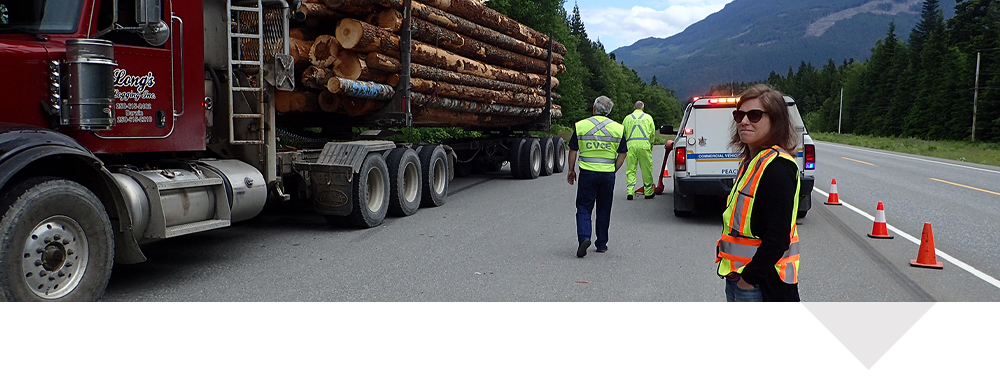
Commercial vehicles are subject to roadside inspections by commercial vehicle safety officers. Each inspection follows the North American protocol, covering the same items. If a violation is found, this is recorded and carries a penalty or a requirement to fix the defect. A commercial vehicle safety inspector can also issue a violation ticket for infractions that are against British Columbia’s Motor Vehicle Act. These may overlap with violations on the inspection list or may be distinct. For example, a commercial vehicle may be stopped for speeding, and then inspected and found to have a brake defect, which is a violation under the inspection protocol.
Each roadside inspection or traffic enforcement activity is considered an intervention. When the intervention uncovers a violation, this is interpreted as having reduced crash risk. The RIEM expresses this risk reduction in terms of crashes prevented as a result of each violation being corrected.
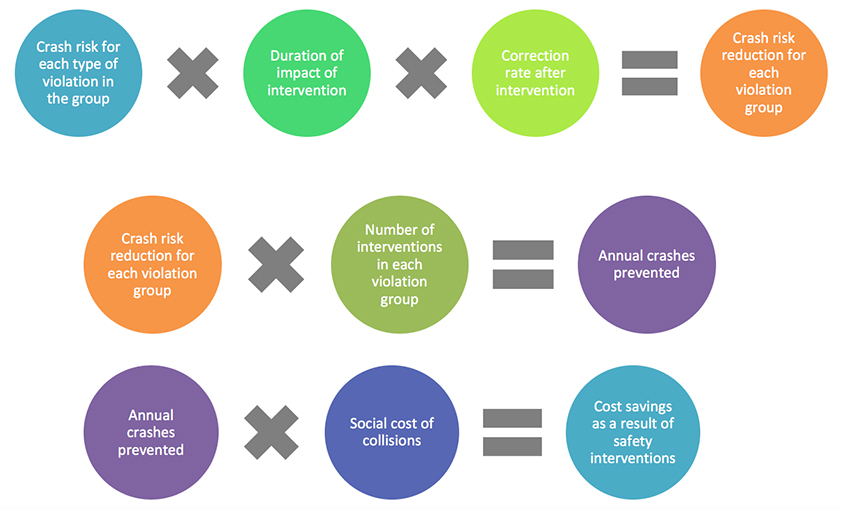
Each violation is classified into a “violation group,” containing related violations that are assigned the same crash risk. For example, “unsafe driving” is a violation group that includes all violations related to unsafe driving, such as running a red light, improper lane change, or failure to yield right of way. The crash risk that RIEM assigns to each violation group was estimated by examining the incidence of particular violations found during post-crash roadside inspections compared with those found during non–crash-related inspections. This is multiplied by the estimated duration of the impact of the intervention, and the estimated correction rate for each intervention, which were also determined based on data from the United States. For example, there are some violations that involve a ban on driving or operating for a specified length of time, and that would be the duration of the impact. Finally, not all interventions result in the operator fixing the violation, so the correction rate has to be factored in.
By summing the crash risk probabilities for violations corrected over all interventions in a given period, the model estimates the number of crashes prevented because of roadside inspection and traffic enforcement (Figure 1).
Using this information, it is possible to estimate the cost savings from safety interventions, using an estimate of the social cost of collisions (which was provided by the ministry).
Figure 1. How the Roadside Inspection Effectiveness Model (RIEM) estimates the number of crashes prevented through commercial vehicle safety interventions:
|
What were the results of our data analysis?
Using the model and data provided by the Ministry of Transportation and Infrastructure, we were able to estimate the number of crashes prevented through commercial vehicle roadside inspections and traffic enforcement from 2014 to 2016 (the period of available data). We also used provincial crash data to estimate the number of injuries and fatalities prevented, and the amount of money saved by preventing those crashes.
The model results suggested that over the three years we analyzed, roadside inspections and enforcement on commercial vehicles in B.C. prevented an estimated 1,100 collisions, as well as four fatalities and more than 260 non-fatal injuries. This saved an estimated $130 million in social costs, including lost working days, medical costs, and around $18 million in provincial insurance expenditures.
The annual number of crashes prevented declined between 2014 and 2016, because of a reduction in the number of roadside inspections and traffic enforcement interventions. This reduction was partly offset by improvements in roadside inspection productivity (that is, there were more violations found per inspection). This improved productivity likely occurred because of increasing participation in an electronic pre-screening program (Weigh2GoBC) that allows inspectors to focus on higher risk vehicles for their in-depth inspections.
Our analysis suggested the ministry could consider options and initiatives to maintain and improve safety enforcement effectiveness despite resource constraints. By using the ministry’s data in a new way, we gave the ministry detailed information and analysis that will help its managers to take informed decisions to improve vehicle safety.
Our analysis was also of interest to the Legislative Assembly; the audit report was reviewed by the Public Accounts Committee in February 2019.
What were the challenges?
Using a data model to test how effective roadside inspections and traffic enforcement are turned out to be a valuable audit procedure. However, doing this involved some challenges, including the following.
Time
As is often the case with data analysis, the greatest time and effort was spent on cleaning up the data and adapting the model to our context. We brought in data from three ministry data systems, and pulled it together using the ACL audit software. This was a long and laborious process, taking approximately three months. Adapting the model and validating the data took another three months. In addition, our IT audit team did IT general controls reviews of the data systems to assess the data reliability. That work took approximately 400 hours over about four months.
Methodology
One challenge in performance auditing is ensuring that data analysis provides data that can be used to conclude against the audit criteria. In our initial plan, we were not sure whether we could use the data analytics as audit evidence. Therefore, we had not established criteria that aligned with the model. As a result, once we confirmed the model’s validity, we needed to adjust one of our criteria to better align it with the model. The audit team had to go back to the ministry to discuss the change and confirm that the new criterion was suitable.
Validation
As part of our report clearance process, we informed the U.S. Department of Transportation that we would be publicly referring to its model in our audit. At this late stage, we were told that the model was being updated. (It had been in use for over 20 years and has been regularly updated.) We did not have concerns that our results were no longer valid, as we had validated the model and adapted it to the B.C. context. But we needed to report that the model was being updated because it could change future reported results using the same data. Because we were reporting an estimate, we needed to alert report users to this possibility. Staying alert to changes like this can be challenging when your attention is focused on completing the various tasks to validate the data, apply the model, and report the results.
What was the impact of our data analysis?
Our audit recommended that the ministry collect and analyze data that would enable it to develop appropriate targets and evaluate the effectiveness of its commercial vehicle safety programs, which the ministry accepted. In its action plan to address the audit recommendations, the ministry committed to working with external experts on data analysis, including developing measurable targets and data collection methodology. The ministry also requested to use the audit’s data analysis to develop a Cabinet submission.
Conclusion
Although this type of data analysis takes considerable time and effort, it was clearly worth it considering the value added to the audit results and to the audited organization.
There are other opportunities, beyond the RIEM, to use data analysis to improve the effectiveness of commercial vehicle safety activities. There is a similar model that assesses the impact of safety interventions with commercial vehicle carriers, called the Carrier Intervention Effectiveness Model. We did not carry out analysis using that model because of time and resource constraints, and also because we considered that by doing the RIEM data analysis, we were demonstrating the value of this type of work to the ministry and providing it with the information it needed to take on similar data analysis work in the future. We have traced a path that it can now follow.
References
- Hyeonshic Shin, Sanjay Bapna, and Ramesh Buddharaju (2014). Maryland Motor Carrier Program Performance Enhancement, State Highway Administration Research Report, MD-14-SP708B4D, Maryland Department of Transportation, Hanover, MD.
- Ministry of Transportation and Infrastructure of British Columbia (2019). Action Plan and Progress Assessment (APPA) for the Implementation of Audit Recommendations from the OAG, Victoria, BC.
- Office of the Auditor General of British Columbia (December 2018). An Independent Audit of Commercial Vehicle Safety, Victoria, BC.
- Office of the Auditor General of Nova Scotia (April 2009). Transportation and Infrastructure Renewal and Service Nova Scotia and Municipal Relations: Truck Safety, Halifax, NS.
- U.S. Department of Transportation, Federal Motor Carrier Safety Administration (April 2017). FMCSA Safety Program Effectiveness Measurement: Carrier Intervention Effectiveness Model (CIEM), Version 1.1, Report for Fiscal Year 2013 Interventions, Washington, DC.
- U.S. Department of Transportation, Federal Motor Carrier Safety Administration (2017). Safety Measurement System (SMS) Methodology: Behavior Analysis and Safety Improvement Category (BASIC) Prioritization Status, Version 3.0.7.
- U.S. Department of Transportation, Federal Motor Carrier Safety Administration (February 2016). FMCSA Safety Program Effectiveness Measurement: Roadside Intervention Effectiveness Model, Fiscal Year 2012, Washington, DC.
Page 2 of 2
DISCLAIMER: The opinions expressed in this article are those of the author and do not necessarily reflect the views of the Foundation.
See more Voices from the Field
- 1
- 2
